Central Place for AI in Your Organization
Open Source and Cloud-Native
Non-Probabilistic Security to Prevent Data Exfiltration
Models could consume prompt injections via MCP uncontrollably - reading your inbox, GitHub issues, or customer inquiries - and follow malicious instructions resulting in data exfiltration.
⚠️ Real attacks examples:
🎬 What you'll see in the demo:
Live demonstration of Archestra's security engine preventing data leaks from private to public GitHub repositories through prompt injection attacks.
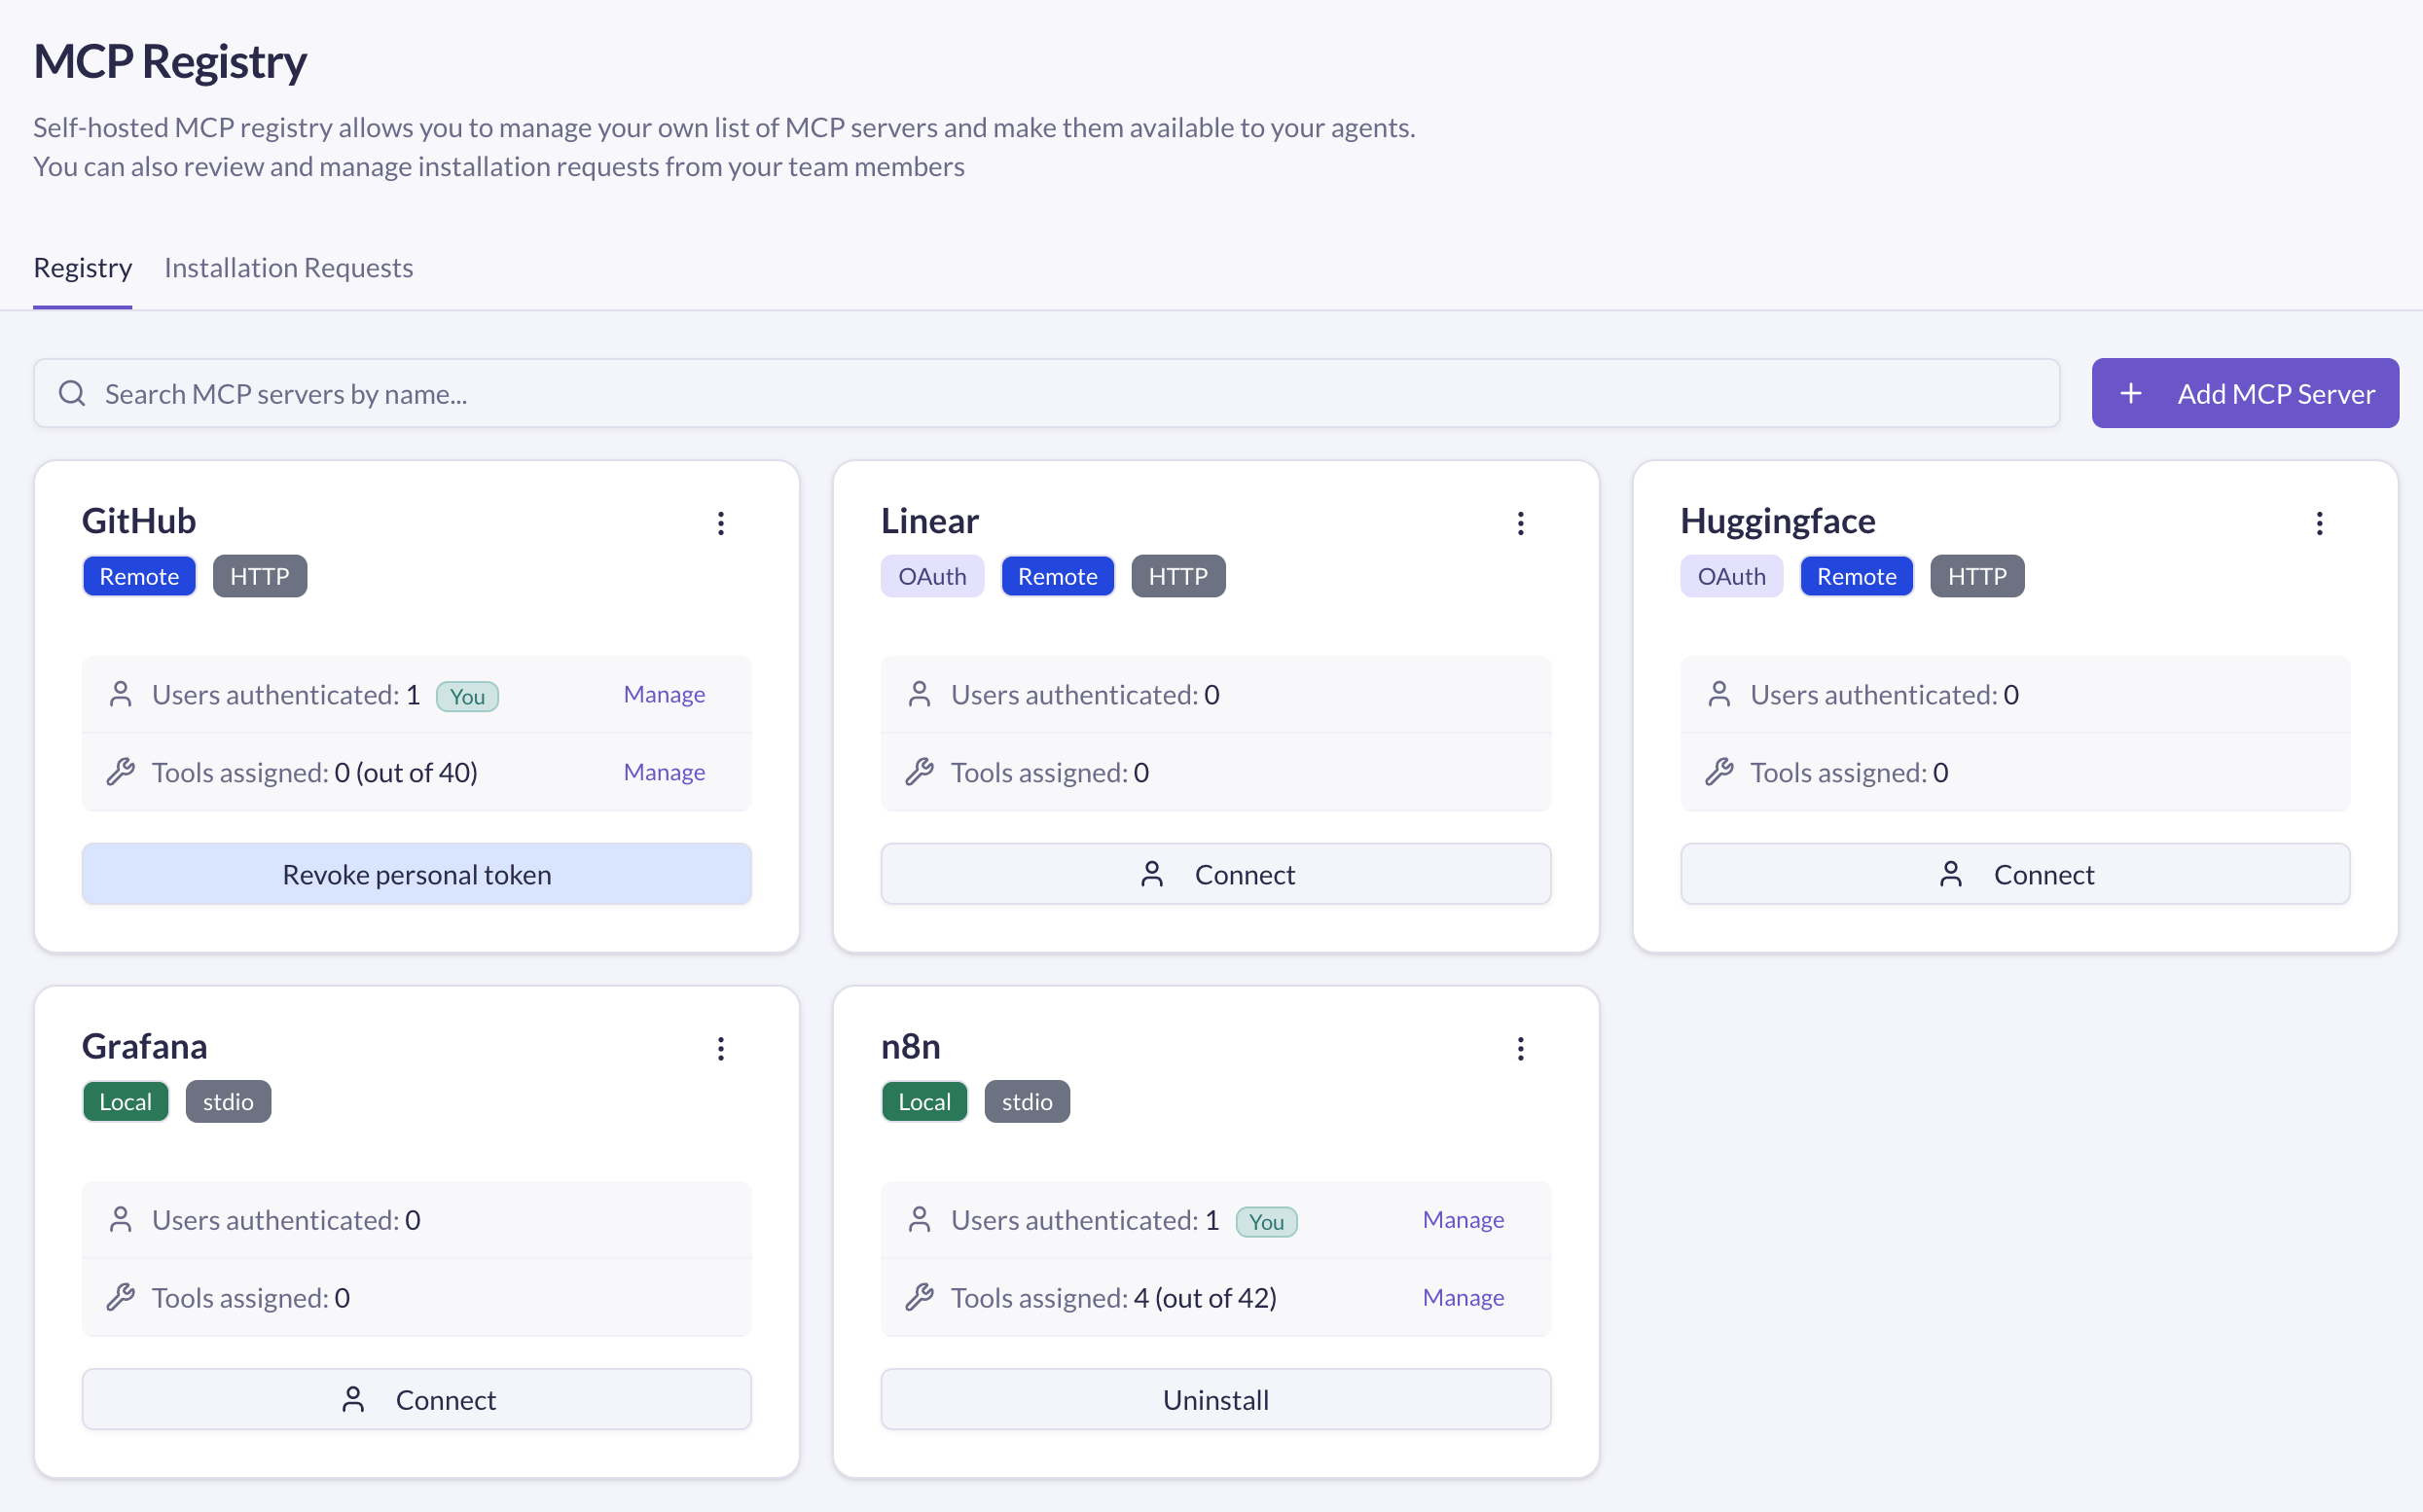
Private MCP Registry with Full Governance
Add MCPs to your private registry to share them with your team: self-hosted and remote, self-built and third-party. Maintain complete control over your organization's MCP ecosystem.
Version Control
Track and manage different versions with full rollback capabilities
Access Management
Granular permissions and team-based access control
Compliance & Governance
Ensure all deployments meet security and compliance standards
Kubernetes-Native MCP Orchestrator
For multi-team and multi-user environments, bring order to secrets management, access control, logging, and observability. Run MCP servers in Kubernetes with enterprise-grade isolation, audit trails, and centralized governance across your entire organization.
Secure Credentials
Store secrets in HashiCorp Vault or Kubernetes Secrets with automatic rotation
Learn about secrets management →Auto-Scaling
Automatic scaling based on load with health checks and monitoring
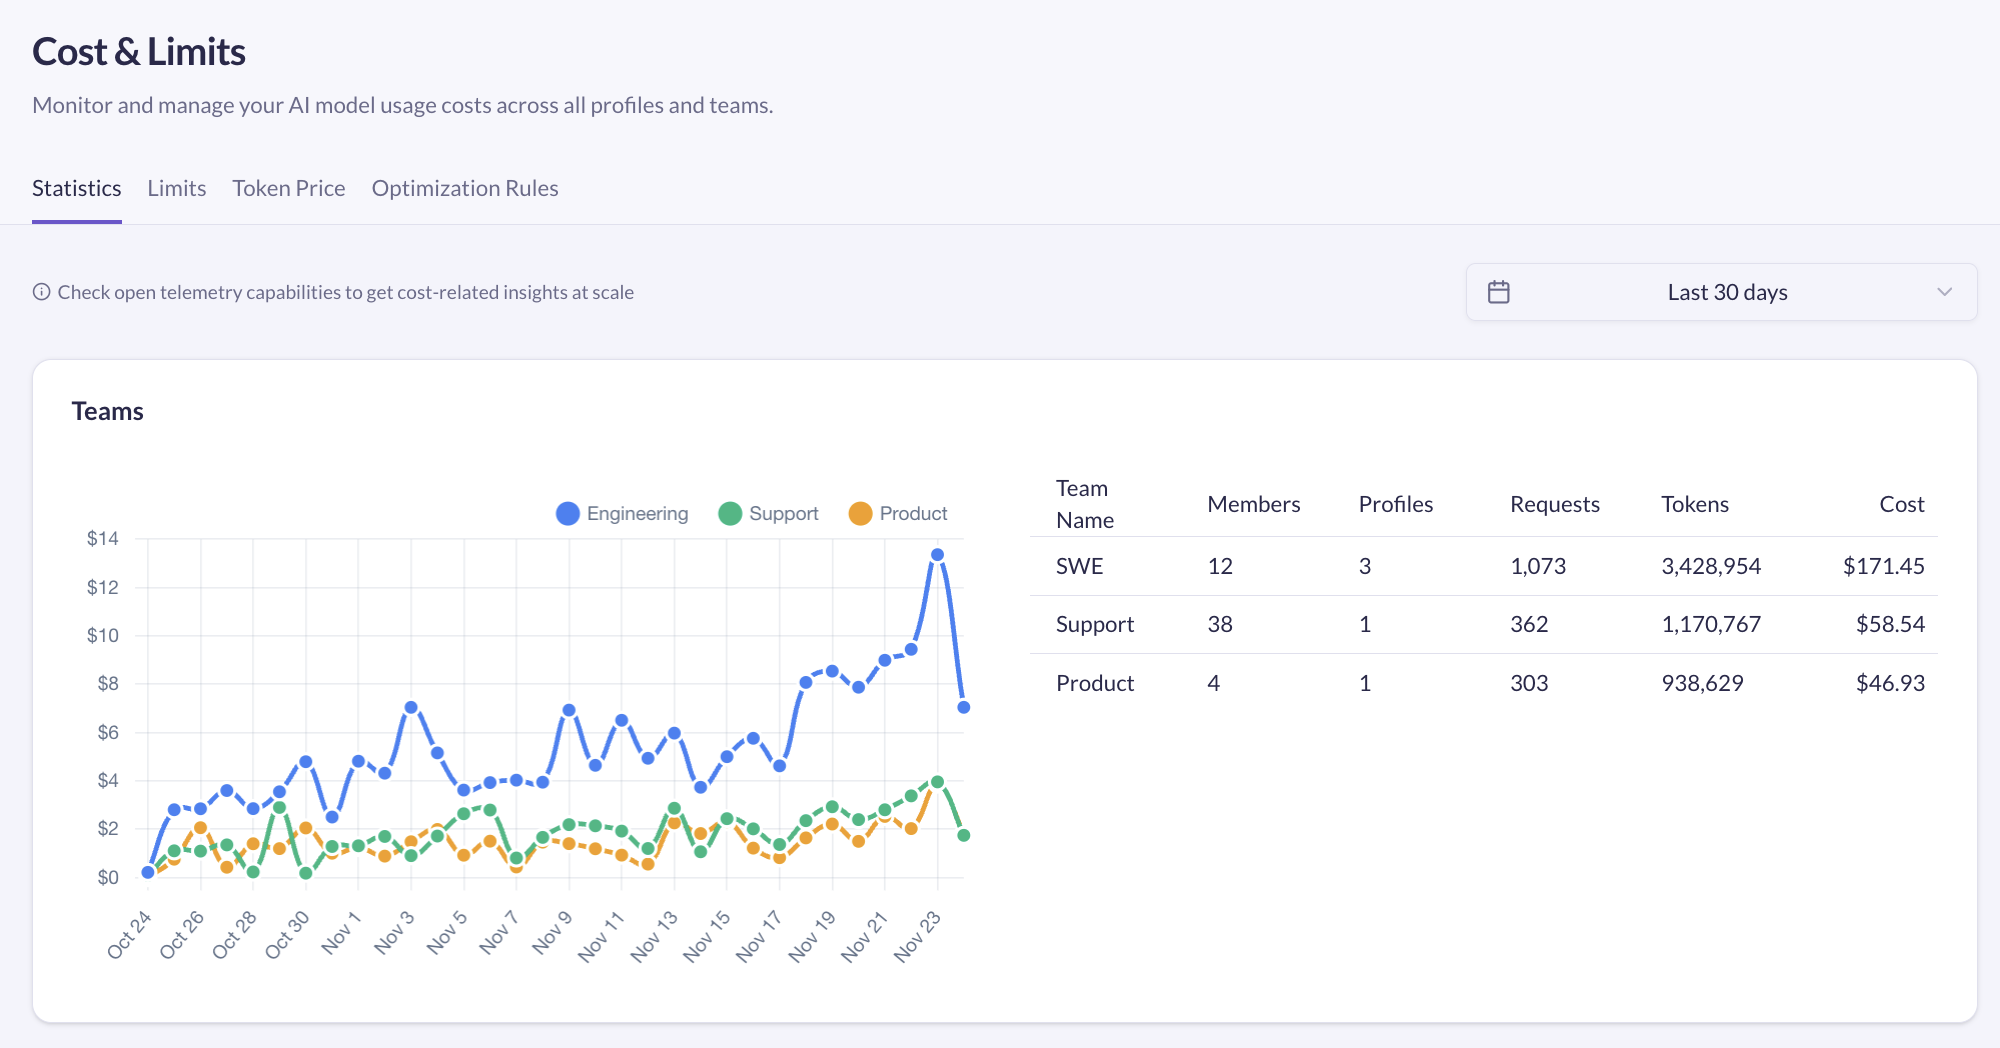
Cost Monitoring, Limits and Dynamic Optimization
Per-team, per-agent or per-organization cost monitoring and limitations. Dynamic optimizer automatically reduces costs up to 96% by intelligently switching to cheaper models for simpler tasks.
Real-time Cost Tracking
Monitor spending across all LLM providers with per-token granularity
Dynamic Model Selection
Automatically switch to cost-effective models for simple tasks
Granular Budget Limits
Set spending limits per team, per agent, or organization-wide
Tool Call & Result Compression
Automatically compress tool calls and results to reduce token usage and costs
96%
Cost Reduction
Real-time
Monitoring
Multi-level
Controls
Works with Your Observability Stack
Export metrics to Prometheus, traces to OpenTelemetry, and visualize everything in Grafana. Track LLM token usage, request latency, tool blocking events, and system performance with pre-configured dashboards.
Prometheus Metrics Export
llm_tokens_total, llm_request_duration_seconds, http_request_duration_seconds
OpenTelemetry Distributed Tracing
Full request traces with span attributes for every LLM API call
Configure tracing →LLM Performance Metrics
Time to first token, tokens per second, blocked tool calls tracking
See LLM metrics →Pre-configured Grafana Dashboards
Ready-to-use dashboards for monitoring your AI infrastructure
Setup Grafana →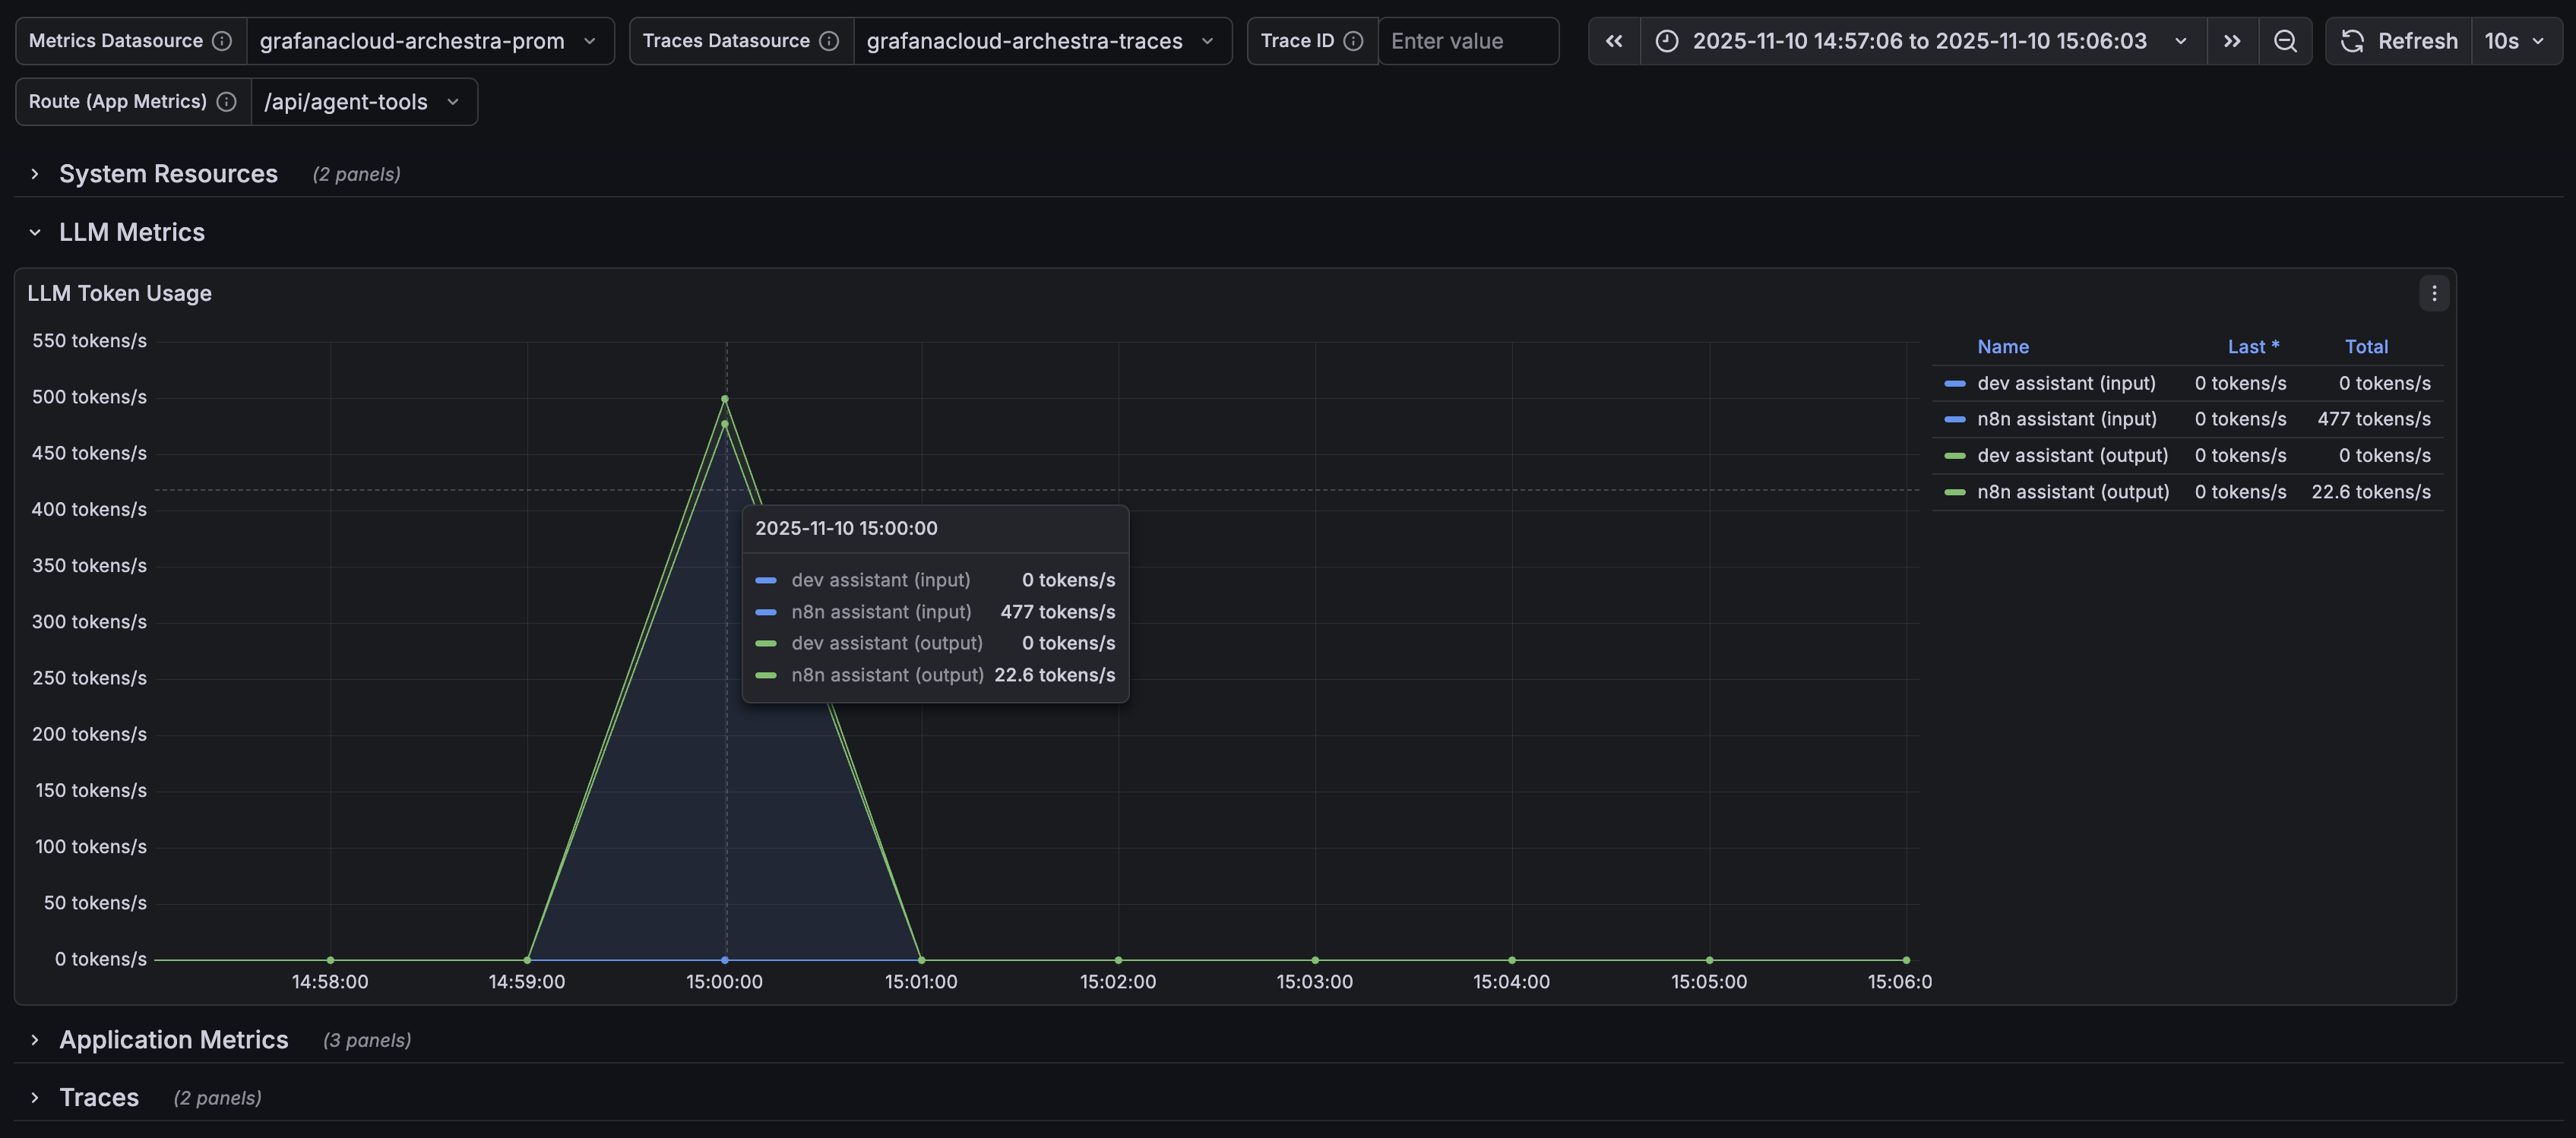
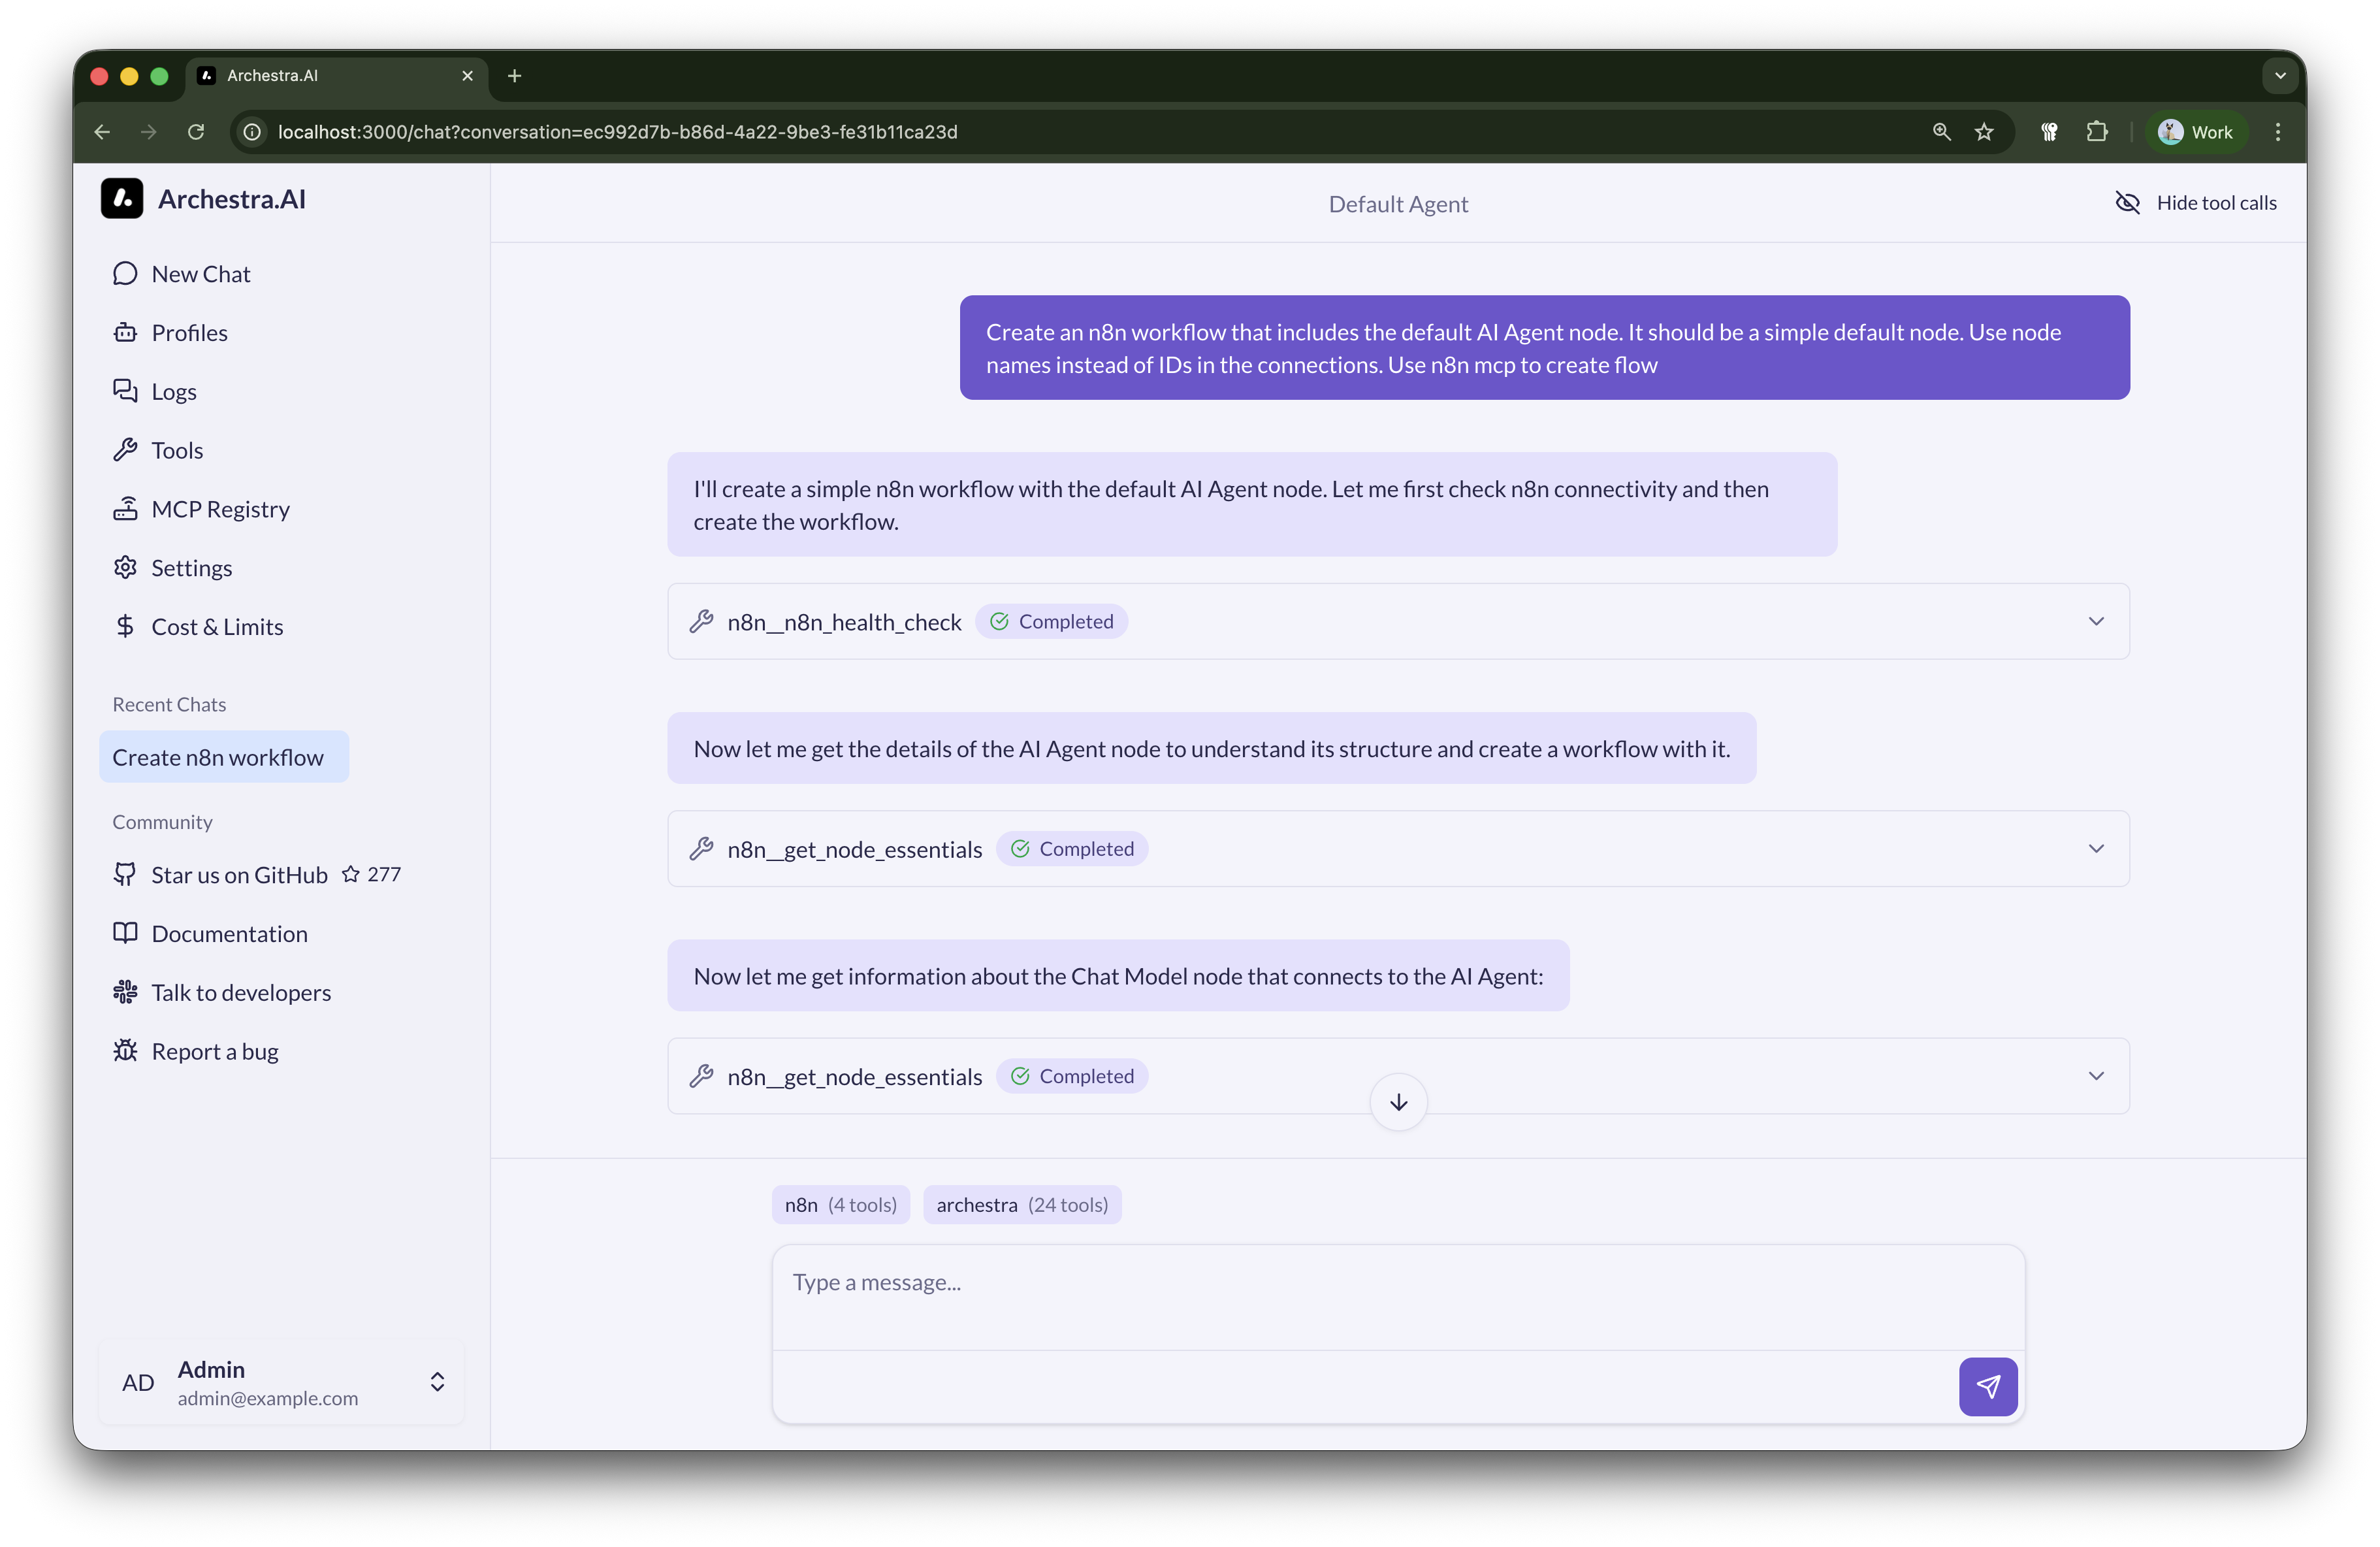
ChatGPT-like Chat with MCPs
Intuitive chat interface for all your users - technical and non-technical alike. Connect to any MCP server from your private registry with a single click. Includes a company-wide prompt library to share best practices across teams.
Private Prompt Registry
Share and reuse proven prompts across your organization
One-Click MCP Access
Connect to any approved MCP server instantly from the interface
Multi-Model Support
Works with Claude, GPT-4, Gemini, and open-source models
Production Ready
Terraform Provider
Automate your entire Archestra deployment with Infrastructure as Code
terraform init archestraHelm Chart
Production-ready Kubernetes deployment with a single command
helm install archestraQuick Start
Deploy Archestra in seconds with Docker
docker pull archestra/platform:latest;
docker run -p 9000:9000 -p 3000:3000 \
  -e ARCHESTRA_QUICKSTART=true \
  -v /var/run/docker.sock:/var/run/docker.sock \
  -v archestra-postgres-data:/var/lib/postgresql/data \
  -v archestra-app-data:/app/data \
archestra/platform;View the full deployment guide for more options
Short, crisp, and to the point e-mails about Archestra
No spam, unsubscribe at any time. We respect your privacy.
Contributors
Thank you for contributing and continuously making Archestra better, you're awesome 🫶